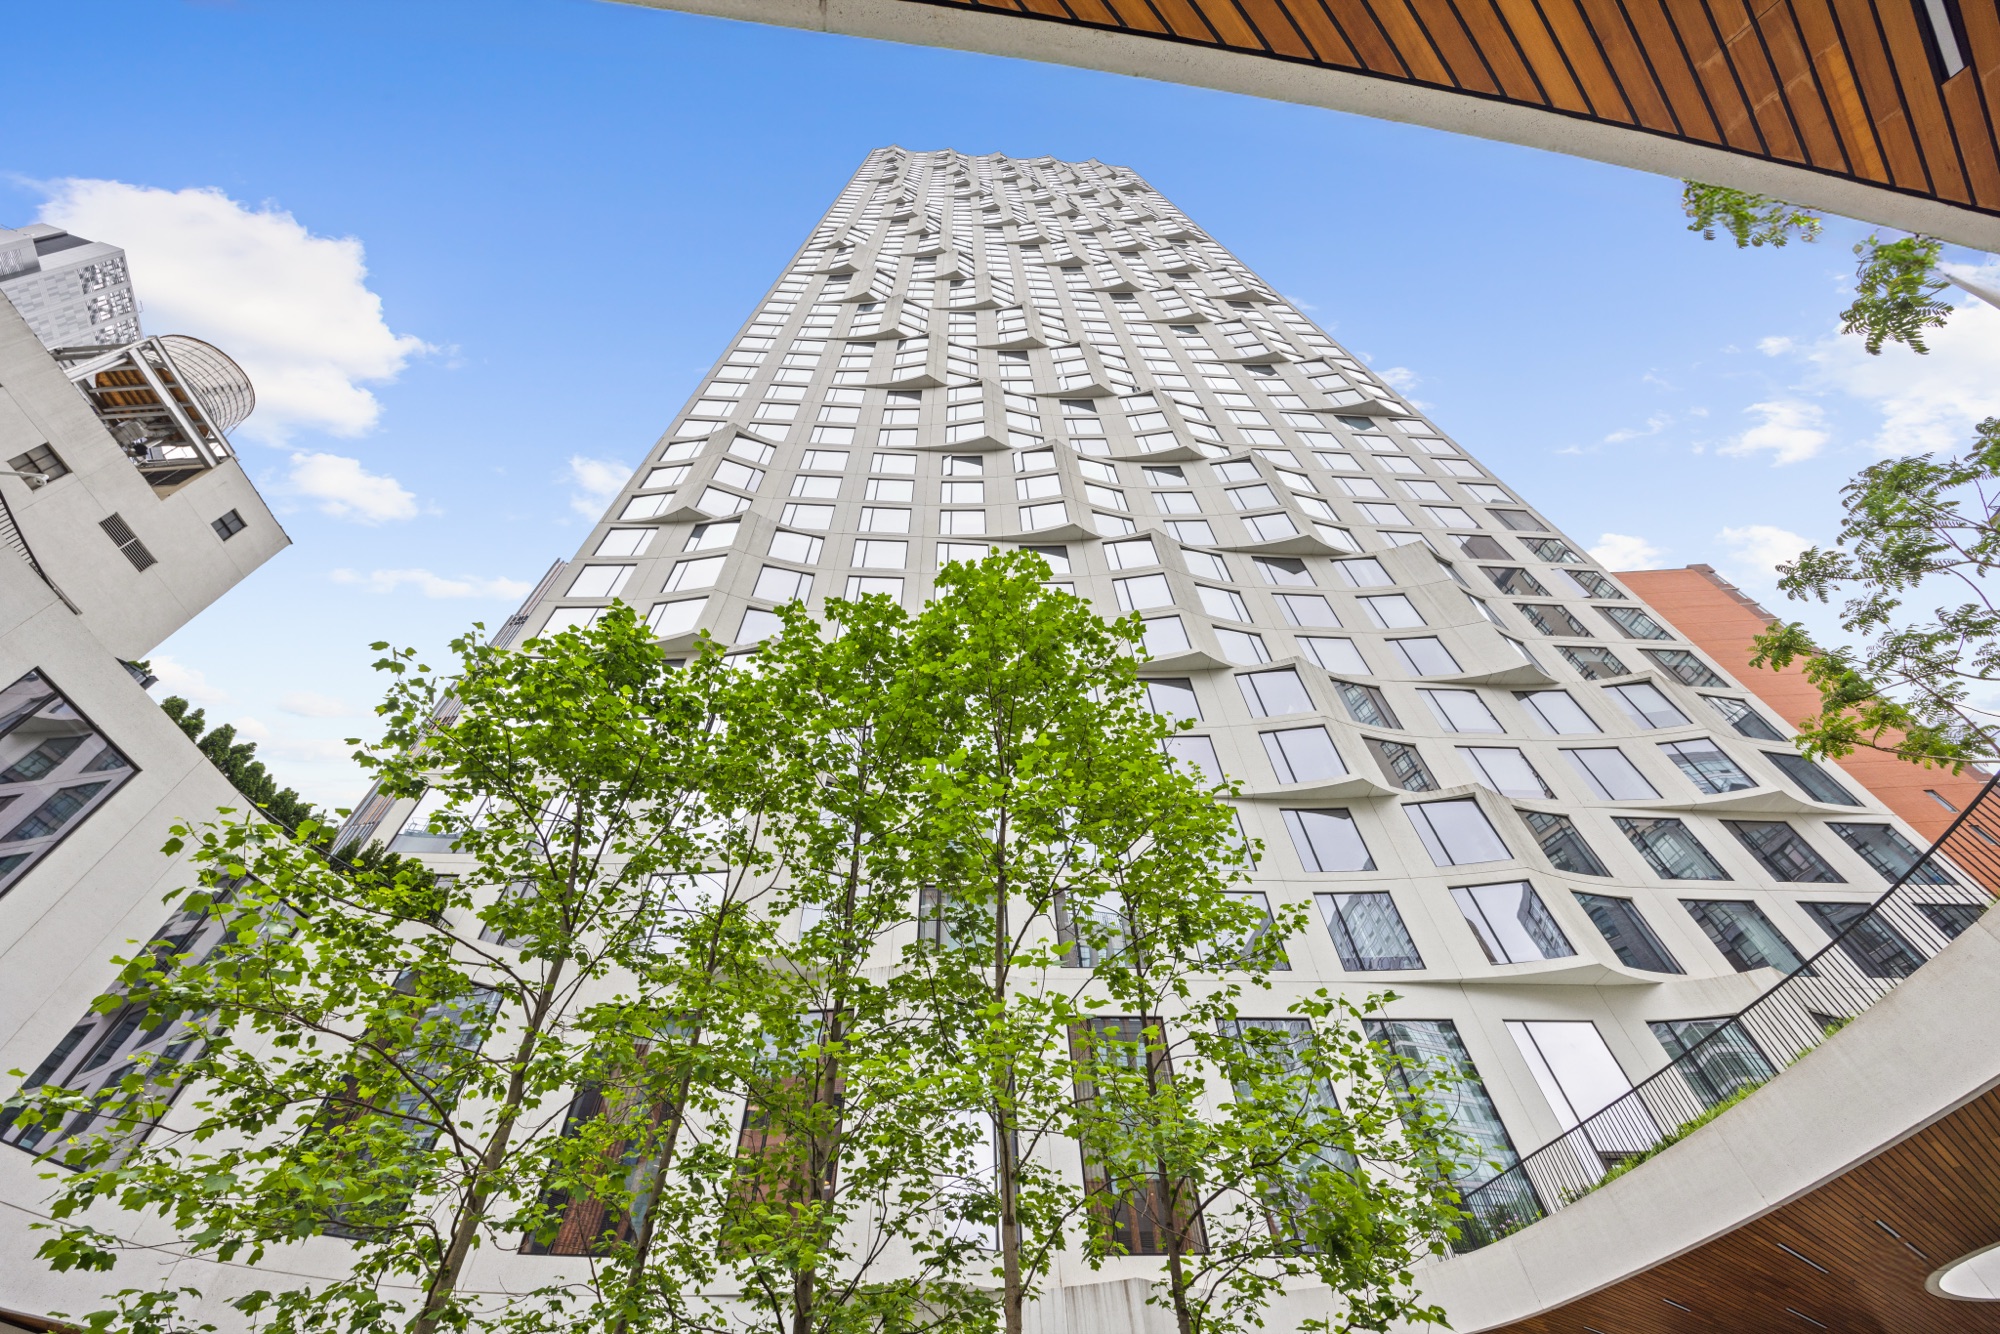
The Insider · Downtown Brooklyn
Q3 2026 Market Report
Steady sales. Smaller homes return. Supply grows.
Presented by your local experts next door, Andreea Miller and Steven Markowicz
Downtown Brooklyn Condos · Q3 2026
Closed Sales
40
+5% year over year
Contracts Signed
22
−31% year over year
Inventory
106
+56% year over year
Days on Market
92
+12% year over year
Median Price
$1.30M
−5% year over year
Average PPSF
$1,342
−6.2% year over year
Q3 2026
Overview
Steady Sales. Smaller Homes Return. Supply Grows.
Downtown Brooklyn’s condo market held steady in the third quarter. Forty closings were recorded, down 7% from a busy second quarter but up 5% from a year ago. Underneath, the mix changed: fewer large new development units closed, and buyers focused on one- and two-bedroom homes, which made up 80% of sales.
Supply built again over the summer. Active listings rose 18% from the second quarter to 106, close to the first-quarter peak and up 56% year-over-year. Buyers have plenty of choice, and average days on market improved to 92 days, from 108 in the second quarter.
Prices reflected the shift in mix. The median price fell to $1,300,000, down 33% from the second quarter and 5% below a year ago, while average price per square foot slipped 6% year-over-year to $1,342. With more moderately priced homes trading, buyers are finding better value per foot than earlier in the year.
Contract activity slowed to 22 signed deals, the fewest in our records going back to 2023, as buyers took their time with a growing selection. Homes priced in line with the market are still selling, but sellers who price ahead of it risk longer marketing times this fall.
Andreea Miller
Closings & Contracts
Sales
In Q3 2026, 40 condo sales closed in Downtown Brooklyn, a 7% decline from the prior quarter but a 5% increase year-over-year. The sales mix moved back toward mid-size homes. Two-bedrooms accounted for 18 of the 40 closings (45%) and one-bedrooms for 14 (35%), while sales of three bedrooms or more fell to 7, from 17 in the second quarter.
Demand shifted to more accessible price points. Twenty-eight sales (70%) closed below $1.5M, and only 7 transactions closed above $2M, compared with 19 in the second quarter. Studio sales fell to just 1, from 6 a year ago, while one-bedroom activity held even at 14. The quarter’s top sale was the four-bedroom penthouse at 76 Schermerhorn Street, which closed for $4,450,000.
Contract activity slowed. Twenty-two contracts were signed in Q3, down 56% from a strong second quarter and 31% year-over-year. Two-bedrooms led with 8 signed contracts (36%), followed by 6 one-bedroom, 5 three-bedroom and 3 studio deals. One City Point accounted for 10 of the 22 signed contracts.
365 Bridge Street was the most active building for closings, with 7 sales, followed by One City Point with 6.
Closed Sales by Bedrooms
Contracts Signed · Q3 2026
- 1 Bedroom6 · 27%
- 2 Bedroom8 · 36%
- 3 Bedroom5 · 23%
- Studio3 · 14%
Sources: Real Plus LLC and Acris
Supply
Inventory
Inventory climbed again in Q3. Active listings rose 18% quarter-over-quarter to 106, close to the first-quarter peak of 110 and 56% higher than a year ago.
Brooklyn Tower at 85 Fleet Street remained the largest source of supply with 21 active listings, followed by 10 Nevins Street (14), One City Point (12), and 289 Schermerhorn Street (8).
One-bedroom homes offered the greatest selection, with 37 active listings, followed by two-bedrooms (34), three-bedrooms (18), and studios (15).
Days on market for closed sales averaged 92 days, down from 108 in the second quarter but up from 82 a year ago. With more listings competing for fewer contracts, pricing and presentation remain critical to a timely sale.
Active Listings by Building
Active Listings by Size
Sources: Real Plus LLC and Acris
Value
Prices
A shift toward smaller, more moderately priced homes pulled headline prices lower in Q3. With homes of three bedrooms or more making up just 18% of closings, the median price fell 33% from the spring.
The median sale price was $1,300,000, down 5% year-over-year, while the average price rose 1.7% to $1,474,409, supported by the $4,450,000 penthouse sale at 76 Schermerhorn Street.
Price per square foot also eased. Median PPSF declined 8.8% year-over-year to $1,258, and average PPSF fell 6.2% to $1,342. Values held firmer for one- and two-bedroom homes, where average PPSF was within 5% of last year.
Median and Average Price
Price Per Square Foot
The Bigger Picture
Brooklyn at Large
Closed Sales
1,481
−3% year over year
+17% quarter over quarter
The modest decline was driven by new development, as resale condo and co-op closings both increased.
Contracts Signed
884
+8% year over year
−27% quarter over quarter
Signed contracts have increased annually in nine of the last twelve quarters.
Days on Market
71
−2% year over year
−3% quarter over quarter
Average days on market fell to the shortest marketing time of any quarter since 2022.
Inventory
2,033
+21% year over year
+1% quarter over quarter
Listed inventory reached its highest level since mid-2022.
Median Price
$866K
−1% year over year
−1% quarter over quarter
Median price dipped 1% due to fewer new development closings but remained the third-highest on record.
Average PPSF
$1,161
0% year over year
0% quarter over quarter
While unchanged, average price per square foot was still the third-highest figure on record.
Brooklyn’s residential market remained fairly steady in Third Quarter 2026. While economic uncertainty and elevated mortgage rates played a role, a 3% slowdown in closings also reflected limited new development supply. Meanwhile, contract activity reinforced that buyers remain engaged: signed contracts climbed 8% from a year ago to their highest third-quarter level since 2022, marking a second straight quarter of annual growth.
The decline in closings, the eighth annual drop in nine quarters, came entirely from new development, which fell 41% as inventory hit its lowest third-quarter level since 2015. Buyers instead turned to resale, where condo closings rose 17% to the highest third-quarter total since 2022 and co-op closings climbed 6% to their highest level of any quarter in four years. Dollar volume edged up 1% to $1.755B, the strongest of any quarter since 2022, as higher prices offset fewer transactions.
Listings grew rapidly, up 21% year-over-year to 2,033. Entry-level listings drove the largest gains: listings under $350K jumped 43% annually and those from $350K to $500K rose 25%, while listings over $2M inched up just 1% as the lack of new development launches limited growth.
A greater share of sales over $2M drove average price up 4% year-over-year to a record $1.185M, while median price dipped by just $9K from last year’s record high. Resale condos led the gains, reaching new highs on every price metric, with median price surging 22% to $1.215M.
Overall, Third Quarter 2026 continued to reflect a bifurcated market, with high-end activity outperforming while affordability pressures weighed on lower-priced segments. Buyers are increasingly turning to resale amid a shortage of new development, and unless a meaningful pipeline of new inventory emerges, targeted supply constraints are likely to keep upward pressure on pricing.
Source: Corcoran Q3 2026 Brooklyn Market Report
Across the Borough
Q3 2026 Stats by Neighborhood
| Neighborhood | Sales | Median price | Average PPSF |
|---|---|---|---|
| Williamsburg & Greenpoint | 190 −8% | $1.733M +24% | $1,610 −3% |
| Brooklyn Heights, Cobble Hill, Dumbo & DowntownDowntown Brooklyn | 242 +40% | $1.363M +1% | $1,486 +3% |
| Carroll Gardens, Boerum Hill & Red Hook | 102 −41% | $1.595M +2% | $1,499 −4% |
| Park Slope & Gowanus | 147 +18% | $1.298M +1% | $1,437 +5% |
| Fort Greene, Clinton Hill & Prospect Heights | 162 +10% | $1.023M −18% | $1,322 −3% |
| Bedford-Stuyvesant, Crown Heights, Lefferts Gardens & Bushwick | 98 −15% | $755K −13% | $918 +1% |
| Kensington, Windsor Terrace, Ditmas Park, Flatbush & Prospect Park South | 105 +1% | $603K −4% | $793 +1% |
| South Brooklyn | 435 −10% | $444K −1% | $562 −7% |
Changes shown are year over year.
How We Measure
Methodology
Metrics
- Previous quarter
- statistics for sales and prices are revised in the subsequent report once data are available for the full quarter period.
- Closed and contracts signed
- figures for the current quarter are based on reported transactions at the time the report was prepared and projected through the end of the quarter.
- Days on market
- averages how long a unit takes to sell and is calculated from list date to contract date. Units on the market longer than three years and shorter than one day are considered outliers and removed from the data to prevent significant skewing.
- Average price per square foot
- is calculated as an average of all prices per square foot.
- Median price and price per square foot
- are the middle or midpoint price where half of sales fall below and half fall above this number.
- Inventory
- is a count of all currently listed units and is measured at end of the quarter. It does not include unsold yet unlisted units in new developments (“shadow” inventory).
Source
Figures in this report are based on publicly reported closed sales information.
Disclaimer
All material presented herein is intended for information purposes only and has been compiled from sources deemed reliable. Though information is believed to be correct, it is presented subject to errors, omissions, changes or withdrawal notice.
Written by
The Miller Markowicz Team at The Corcoran Group
Andreea Miller and Steven Markowicz are licensed real estate agents at The Corcoran Group specializing in condos, co-ops, townhouses, and new development across Manhattan and Brooklyn — including Downtown Brooklyn, DUMBO, Williamsburg, Park Slope, Chelsea, and the Upper East Side.
Co-Founder · Licensed Associate Real Estate Broker
Recognized among The Corcoran Group's Top 25 agents and ranked in the top 1.5% of agents nationwide by RealTrends. Known for analytical rigor in pricing and a design-led approach to preparing and presenting homes.
Co-Founder · Licensed Real Estate Salesperson
A background in luxury hospitality shapes a client experience built on anticipation and responsiveness. Focused on Downtown Brooklyn, DUMBO, Williamsburg, and Boerum Hill, with deep new development experience.
Track Record
200+ transactions closed across Manhattan and Brooklyn
Top 25 at The Corcoran Group, five of the last six months
Top 1.5% of agents nationwide by RealTrends

Thinking of Buying or Selling in NYC?
Whether you're searching for your dream home or looking to sell at the best possible price, The Miller Markowicz Team is here to guide you every step of the way.